How to Read Bitcoin Charts for Beginners: A 2024 Masterclass
Welcome. If you’ve ever opened a Bitcoin chart and felt like you were staring at a foreign language, you’re in the right place. Lines going up and down, red and green bars, cryptic numbers everywhere—it’s designed to be intimidating.
But what if I told you that learning to read these charts is the single most important skill you can develop on your crypto journey? It’s the difference between gambling and making informed decisions. It’s how you begin to understand the story the market is telling.
In my 20 years in the digital information space, I’ve seen one thing consistently separate the successful from the frustrated: the ability to interpret data. A Bitcoin chart is just that—a visual representation of data. And by the end of this comprehensive guide, you won’t just know how to read it; you’ll understand what it’s saying.
You will learn:
- The fundamental anatomy of any crypto chart.
- The secret language of Japanese Candlesticks (it’s easier than you think).
- How to identify the market’s “floor” and “ceiling” using Support and Resistance.
- Two of the most powerful beginner-friendly indicators to give you an edge.
- A 5-step framework to analyze any chart, starting today.
Let’s decode the market together.
Table of Contents
- Why Reading Charts is Your First Trading Superpower
- The Anatomy of a Bitcoin Chart: Your Playing Field
- The Story in a Candle: How to Read Japanese Candlesticks
- Support and Resistance: The Battlegrounds of Price
- Your First Technical Indicators: Seeing the Unseen
- Putting It All Together: A 5-Step Beginner’s Checklist
- Where to Practice Reading Charts Risk-Free
- Frequently Asked Questions (FAQ)
- Final Thoughts: Your Journey Starts Now
1. Why Reading Charts is Your First Trading Superpower
Before we dive into the “how,” let’s talk about the “why.” Why not just listen to influencers on X (Twitter) or buy when everyone else is euphoric?
Because relying on others is a recipe for disaster. Learning to read a chart gives you autonomy.
- It Filters Out the Noise: The crypto market is filled with hype, fear, and opinions. A chart is pure data. It shows you what is actually happening, not what someone wants to happen.
- It Provides Context: Is Bitcoin’s price of $70,000 high or low? Without a chart, the number is meaningless. With a chart, you can see its entire history, identify trends, and make a much more educated guess.
- It Helps You Manage Risk: Charting is the foundation of risk management. It helps you identify logical places to enter a trade, take profits, and, most importantly, cut losses before they become catastrophic. As defined by financial experts at Cointelegraph, technical analysis is a key tool for traders to forecast future price movements.
Learning this skill is your first step from being a passive passenger to an active driver in your financial journey.
2. The Anatomy of a Bitcoin Chart: Your Playing Field
Every chart you see on platforms like Bybit or Binance shares a few core components. Let’s break them down.

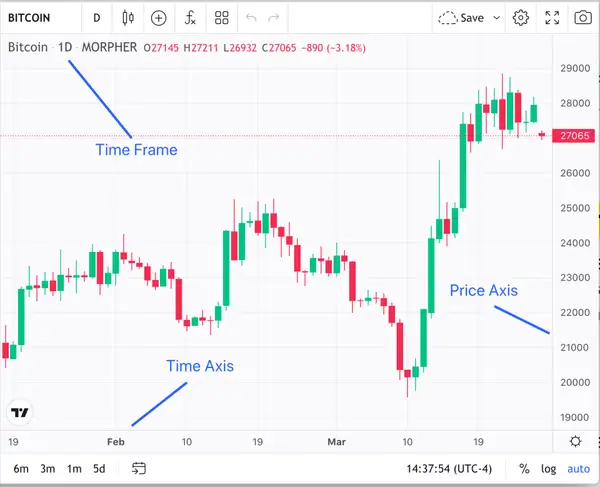
The Price Axis (Y-Axis) and Time Axis (X-Axis)
This is the most basic element.
- The Vertical Axis (Y-Axis): This is the Price. The higher up the chart, the higher the price of Bitcoin.
- The Horizontal Axis (X-Axis): This is Time. It can be set to minutes, hours, days, weeks, or even months. As you move from left to right, you are moving forward in time.
Choosing Your Timeframe: From Minutes to Months
The “story” a chart tells can change dramatically depending on the timeframe you choose.
- Low Timeframes (e.g., 1-minute, 15-minute): Favored by scalpers and day traders. They show a lot of “noise” but are useful for finding short-term entry and exit points.
- Mid Timeframes (e.g., 1-hour, 4-hour): Used by swing traders looking to capture moves that last a few days or weeks. This is a great place for beginners to start as it’s less chaotic.
- High Timeframes (e.g., Daily, Weekly): Used by investors and long-term traders to identify the major, overarching trend.
Pro-Tip: Always start your analysis on a higher timeframe (like the Daily chart) to understand the main trend before “zooming in” to lower timeframes.
Understanding Trading Volume: The Crowd’s Footprint
At the bottom of most charts, you’ll see a series of vertical bars. This is the Trading Volume.
- What it is: Volume represents the total amount of Bitcoin traded during that specific period (e.g., in that one day).
- Why it matters: Volume is a measure of conviction. A price move (either up or down) that is accompanied by high volume is considered more significant and valid than a move on low volume. Think of it as the difference between a whisper and a shout.
3. The Story in a Candle: How to Read Japanese Candlesticks
This is the heart of reading a chart. Those red and green bars are called “candlesticks,” and each one tells a detailed story about the battle between buyers and sellers during a specific timeframe.
The Four Pillars: Open, High, Low, Close (OHLC)
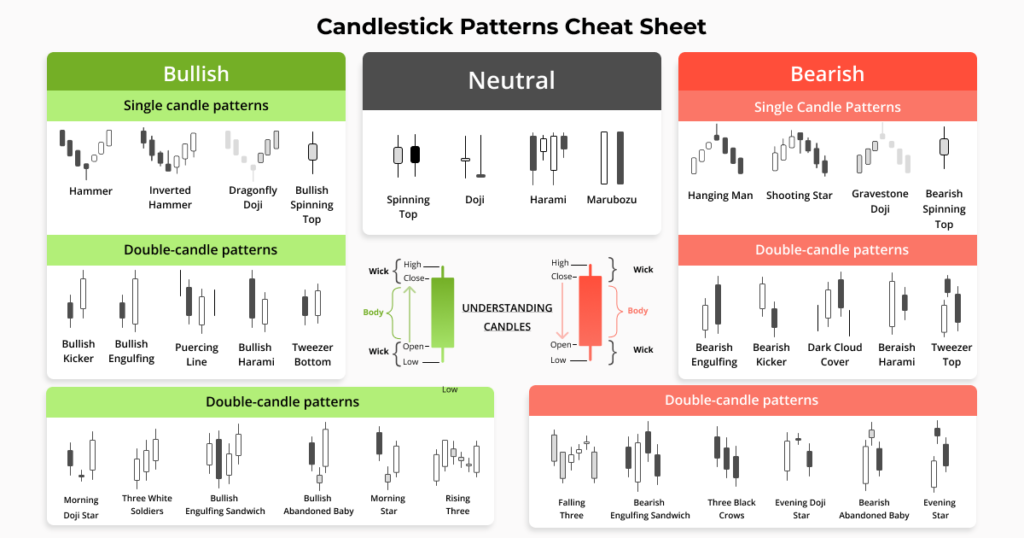
Each and every candlestick gives you four pieces of crucial information:
- Open: The price at the very beginning of the period.
- High: The absolute highest price reached during the period.
- Low: The absolute lowest price reached during the period.
- Close: The price at the very end of the period.
This OHLC data is the DNA of price action.

Bullish vs. Bearish: The Battle of Green and Red
- A Green (Bullish) Candle: This happens when the Close price is HIGHER than the Open price. It means buyers were in control during that period and pushed the price up.
- A Red (Bearish) Candle: This happens when the Close price is LOWER than the Open price. It means sellers were in control and pushed the price down.
Bodies vs. Wicks: Price Action vs. Price Rejection
- The Body: This is the thick, colored part of the candle. It represents the range between the open and close price. A long body shows strong buying or selling pressure.
- The Wicks (or Shadows): These are the thin lines sticking out of the top and bottom of the body. They represent the High and Low of the period. Long wicks indicate significant volatility and “price rejection”—where the market tried to go to a certain level but was pushed back.
3. Basic Candlestick Patterns Every Beginner Must Know
Thousands of patterns exist, but you only need to know a few to get started.
Mastering just these three patterns will put you ahead of 90% of other beginners.
4. Support and Resistance: The Battlegrounds of Price
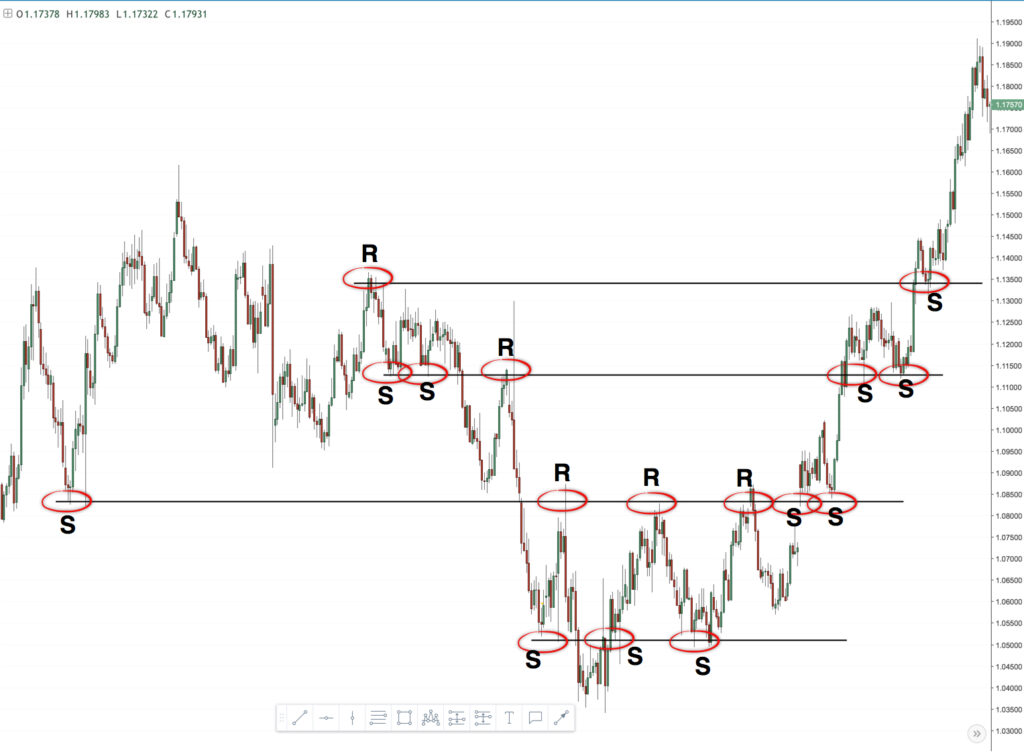
If candlesticks are the soldiers, support and resistance levels are the key battlegrounds where wars are won and lost. These are the most practical and powerful concepts in all of technical analysis.
What is a Support Level? (The Floor)
Support is a price level where a downtrend can be expected to pause due to a concentration of demand or buying interest.
Think of it as a floor that the price has trouble breaking through. When the price of Bitcoin approaches a support level, it’s an area where buyers are likely to step in and start buying, pushing the price back up. A level becomes stronger every time the price “bounces” off it.
What is a Resistance Level? (The Ceiling)
Resistance is the opposite of support. It’s a price level where an uptrend can be expected to pause due to a concentration of selling interest.
Think of it as a ceiling that the price has trouble breaking through. As the price nears resistance, sellers are more inclined to sell and take profits, which pushes the price back down.

How Trend Lines Reveal the Market’s Direction
Support and resistance don’t always have to be horizontal. They can be diagonal, forming trend lines.
- Uptrend: Characterized by a series of higher highs and higher lows. You can draw an ascending trend line by connecting the lows.
- Downtrend: Characterized by a series of lower highs and lower lows. You can draw a descending trend line by connecting the highs.
Key takeaway: The trend is your friend. As a beginner, it’s always easier and safer to trade with the prevailing trend, not against it.
5. Your First Technical Indicators: Seeing the Unseen
Indicators are mathematical calculations based on price and/or volume that are plotted on a chart. They help clarify price action and can provide trading signals. There are thousands, but let’s focus on two of the most popular and easy-to-understand ones.
Moving Averages (MA): Smoothing Out the Noise
A Moving Average (MA) does exactly what its name implies: it calculates the average price of Bitcoin over a specific number of periods and plots it as a line on your chart.
- Purpose: To smooth out the chaotic short-term price fluctuations and help you identify the underlying trend more clearly.
- Common MAs:
- 50-day MA: A key medium-term trend indicator.
- 200-day MA: The “holy grail” for long-term trend. If the price is above the 200MA, the long-term trend is generally considered bullish. If it’s below, it’s bearish.
- How to use it: When a shorter-term MA (like the 50) crosses above a longer-term MA (like the 200), it’s a bullish signal called a “Golden Cross.” The opposite is a “Death Cross.”
The Relative Strength Index (RSI): Is Bitcoin Overbought or Oversold?
The RSI is a momentum oscillator. It measures the speed and change of price movements on a scale of 0 to 100.
- Purpose: To identify overbought and oversold conditions.
- How to read it:
- Overbought (RSI > 70): Suggests that Bitcoin has risen too far, too fast, and might be due for a pullback or correction. It’s a signal to be cautious about buying.
- Oversold (RSI < 30): Suggests that Bitcoin has fallen too far, too fast, and might be due for a bounce. It’s a signal that sellers may be exhausted.
The RSI is a powerful tool, but it should never be used in isolation. Always confirm its signals with other factors, like support and resistance.
6. Putting It All Together: A 5-Step Beginner’s Checklist
You’ve learned the components. Now, how do you apply them? Here is a simple, repeatable process you can use every time you look at a new chart.
Step 1: Pick Your Timeframe & Identify the Macro Trend
- Start with the Daily chart. Is the price generally moving up and to the right (uptrend) or down and to the right (downtrend)? Is it above or below the 200-day MA? This gives you the big picture.
Step 2: Draw Your Key Support & Resistance Levels
- Look for obvious price levels where the market has “bounced” or been rejected multiple times. Draw horizontal lines at these key areas. These are your battlegrounds.
Step 3: Analyze Recent Candlesticks
- Zoom in on the most recent price action. Are you seeing long green bodies (strong buying)? Long wicks (indecision)? Any of the basic patterns we discussed, like a Hammer or an Engulfing candle near a support level?
Step 4: Check Your Indicators (MA & RSI)
- Is the price above or below the 50-day MA? Is the RSI in overbought (>70) or oversold (<30) territory, or is it neutral? This adds another layer of confirmation.
Step 5: Form a Simple Hypothesis
- Based on the previous four steps, form a simple, unbiased opinion. Example: “The overall trend is up. The price is currently pulling back to a strong support level around $60,000. The RSI is approaching oversold territory. This could be a potential buying opportunity if we see a bullish candlestick pattern form at this support.”
This structured approach transforms chart reading from a guessing game into a methodical analysis.
7. Where to Practice Reading Charts Risk-Free
Knowledge is useless without application. The absolute best way to get good at reading charts is to do it every single day. But you don’t have to risk real money to learn.
The top-tier exchanges provide excellent charting tools powered by TradingView, and most offer a “demo account” or “paper trading” feature. This allows you to practice your analysis and make trades with simulated money.
Here are some of the best platforms for beginners to start practicing:
- Binance: The world’s largest exchange with robust charting tools and a massive amount of educational content.
- Bybit: Known for its user-friendly interface and powerful derivatives platform, making it great for when you advance to futures trading.
- Coinbase: Praised for its simplicity and security, it’s an excellent starting point for new users to get comfortable with basic charts.
- OKX: Offers a fantastic suite of tools, including a dedicated demo trading account to hone your skills.
Action Step: Sign up for one of these platforms, open the Bitcoin/USD chart, and start applying the 5-step checklist. Practice drawing support and resistance lines every day. It’s the fastest way to build your confidence.
Risk Disclaimer: Trading cryptocurrencies, especially with leverage, involves a high degree of risk and may not be suitable for all investors. The information provided in this article is for educational purposes only and should not be considered financial advice. You should be aware of the risks and be willing to accept them in order to invest in the crypto markets. Never trade with money you cannot afford to lose.
8. Frequently Asked Questions (FAQ)
Q1: What is the best timeframe to use for a beginner? For beginners, the 4-hour (4H) or Daily (1D) timeframes are ideal. They move slowly enough that you have time to analyze the chart without feeling rushed, and they filter out much of the chaotic “noise” seen on lower timeframes like the 1-minute or 5-minute charts.
Q2: Can I predict the price of Bitcoin with 100% accuracy using charts? Absolutely not. Technical analysis is not a crystal ball; it is a game of probabilities. It helps you identify scenarios where the odds are in your favor. There are no guarantees in any market. The goal is to manage risk and make educated decisions, not to be right every time.
Q3: Do I need expensive software to read charts? No. Every major crypto exchange (Kraken, Gate.io, etc.) provides powerful and free charting tools directly on their platform. The free version of TradingView is also more than enough for any beginner or intermediate trader.
Q4: How long does it take to get good at reading charts? Like any skill, it takes practice. If you spend 15-30 minutes every day analyzing the Bitcoin chart and applying the concepts in this guide, you will feel significantly more confident within a few weeks. Consistency is more important than intensity.
9. Final Thoughts: Your Journey Starts Now
You’ve just absorbed the foundational knowledge that underpins the entire world of crypto trading. You’ve moved from the realm of the unknown into the realm of the understandable.
The chart is no longer a random series of lines; it’s a story of human psychology, a constant battle between fear and greed, supply and demand. You now have the tools to read that story.
Your next steps are simple:
- Practice: Open a chart and start identifying the concepts you learned today.
- Learn Continuously: This guide is your foundation. From here, you can explore more advanced topics like our guides on Bitcoin Futures Trading or Advanced Risk Management.
- Stay Curious: The market is always evolving, and so should you.
Welcome to the first day of your new, more informed crypto journey. You’re now equipped to see the market with a clarity you didn’t have before. Use it wisely.
